# Set chart title and label axes. 标题及坐标轴 ax.set_title("Square Numbers", fontsize=24) ax.set_xlabel("Value", fontsize=14) ax.set_ylabel("Square of Value", fontsize=14)
# Set size of tick labels. 刻度标记大小 ax.tick_params(axis='both', labelsize=14)
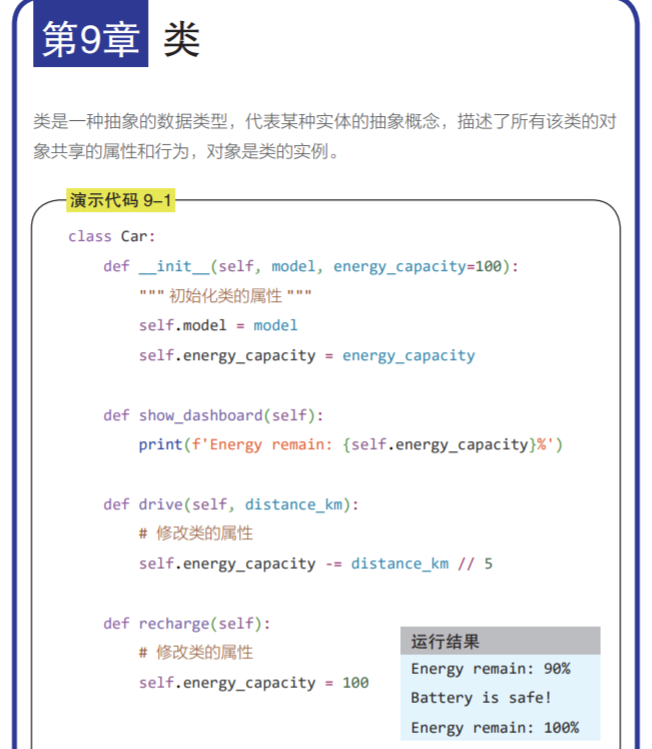
classRandomWalk: """A class to generate random walks.""" def__init__(self, num_points=5000): """Initialize attributes of a walk.""" self.num_points = num_points # All walks start at (0, 0). self.x_values = [0] self.y_values = [0]
deffill_walk(self): """Calculate all the points in the walk.""" # Keep taking steps until the walk reaches the desired length. whilelen(self.x_values) < self.num_points: # Decide which direction to go and how far to go in that direction. x_direction = choice([1, -1]) x_distance = choice([0, 1, 2, 3, 4]) x_step = x_direction * x_distance y_direction = choice([1, -1]) y_distance = choice([0, 1, 2, 3, 4]) y_step = y_direction * y_distance # Reject moves that go nowhere. if x_step == 0and y_step == 0: continue # Calculate the new position. x = self.x_values[-1] + x_step y = self.y_values[-1] + y_step self.x_values.append(x) self.y_values.append(y)
# Keep making new walks, as long as the program is active. whileTrue: # Make a random walk. rw = RandomWalk(50_000) rw.fill_walk()
# Plot the points in the walk. plt.style.use('classic') fig, ax = plt.subplots(figsize=(15, 9)) 指定生成的图形尺寸 point_numbers = range(rw.num_points) ax.scatter(rw.x_values, rw.y_values, c=point_numbers, cmap=plt.cm.Blues, edgecolors='none', s=1) 删除点的黑色轮廓 # Emphasize the first and last points.绘制起点和终点 ax.scatter(0, 0, c='green', edgecolors='none', s=100) ax.scatter(rw.x_values[-1], rw.y_values[-1], c='red', edgecolors='none', s=100)
# Remove the axes.隐藏坐标轴 ax.get_xaxis().set_visible(False) ax.get_yaxis().set_visible(False)
plt.show()
keep_running = input("Make another walk? (y/n): ") if keep_running == 'n': break
掷骰子
1 2 3 4 5 6 7 8 9 10 11 12 13
from random import randint
classDie: """A class representing a single die.""" def__init__(self, num_sides=6): """Assume a six-sided die.""" self.num_sides = num_sides defroll(self): """"Return a random value between 1 and number of sides.""" return randint(1, self.num_sides)
from plotly.graph_objs import Bar, Layout from plotly import offline
from die import Die
# Create two D6 dice. die_1 = Die() die_2 = Die()
# Make some rolls, and store results in a list. results = [] for roll_num inrange(1000): result = die_1.roll() + die_2.roll() results.append(result) # Analyze the results. 计算每个点出现的次数 frequencies = [] max_result = die_1.num_sides + die_2.num_sides for value inrange(2, max_result+1): frequency = results.count(value) frequencies.append(frequency) # Visualize the results. x_values = list(range(2, max_result+1)) list转换成列表 data = [Bar(x=x_values, y=frequencies)] bar()表示用于绘制条形图的数据集
x_axis_config = {'title': 'Result', 'dtick': 1} y_axis_config = {'title': 'Frequency of Result'} my_layout = Layout(title='Results of rolling two D6 dice 1000 times', xaxis=x_axis_config, yaxis=y_axis_config) 布局对象 offline.plot({'data': data, 'layout': my_layout}, filename='d6_d6.html')