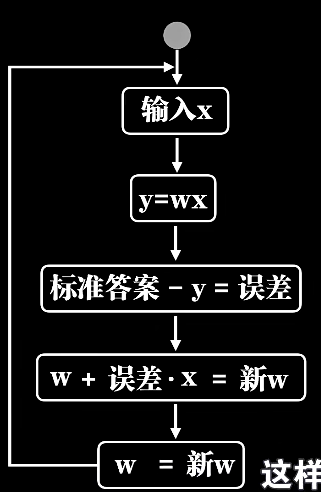
1
2
3
4
5
6
7
8
9
10
11
12
13
14
15
16
17
18
19
20
21
22
23
24
25
26
27
28
29
30
31
32
33
34
35
36
37
38
39
40
41
42
43
44
45
46
47
48
49
50
| import matplotlib.pyplot as plt
import dataset
import numpy as np
from mpl_toolkits.mplot3d import Axes3D
m=100
xs,ys = dataset.get_beans(m)
plt.title("Size-Toxicity Function", fontsize=12)
plt.xlabel('Bean Size')
plt.ylabel('Toxicity')
plt.scatter(xs, ys)
w=0.1
b=0.1
y_pre = w*xs+b
plt.plot(xs,y_pre)
plt.show()
ws = np.arange(-1,2,0.1)
bs = np.arange(-2,2,0.1)
fig = plt.figure()
ax = Axes3D(fig)
ax.set_zlim(0,2)
for w in ws:
es = []
for b in bs:
y_pre = w*xs+b
e = (1/m)*np.sum((ys-y_pre)**2)
es.append(e)
figure = ax.plot(bs, es, w, zdir='y')
plt.show()
|

